How to Trade Commodities: A primer
Finally, an actionable guide on how to trade commodities!
In this post I’ll give you a wide and shallow overview of different aspects of commodities trading that I have learned over time. If you are a novice trader, some things may be confusing, but that’s fine for now. Take it as a primer, where you can pick ideas to delve deeper into, to form your own understanding of the intricacies of the trading business.
Commodities can be accessed by retail traders through linear instruments such as:
Futures
CFD, Cash-based
CFD, Expiring
Spread Bets (*UK only)
ETF, Physical Holding
ETN (exchange traded notes) (unsecured debt instruments)
ETC (exchange traded commodities). UK regulated.
ETF of commodity producers
Stocks of commodity producing companies
The payoff of linear instruments such as futures and stocks have a direct relationship with market movements. Their value changes linearly with underlying asset price. Non-linear instruments, such as options, have asymmetrical payoff. I’m not trading options (yet).
ETP, ETF, ETN, ETC differences
When digging for ETF information online, you can find several different names thrown around, which can be confusing. Here’s some quick clarification:
ETP: A broad term that includes any investment product that trades on a stock exchange and tracks an underlying asset or index.
ETF: A marketable security that tracks an index, a commodity, bonds, or a basket of assets like an index fund but trades like a stock on an exchange. (Source: TradingView)
ETN: A type of unsecured debt security that tracks an underlying index of securities and trades on a major exchange like a stock. (Source: Investopedia)
ETC: Similar to ETN, but collateralized by holding of physical commodity. Traded in London stock exchange (Source: Investopedia)
ETFs have lower counter-party risk, especially the ones which have physical holdings. ETNs and ETCs have higher counter-party risk because the entire value of is dependent on a single counterparty’s ability to make good on its promises.
There’s a nice explanation on counter-party risks from ETF.com, for more details on risks: ETP counter-party risks explanation
CFD Cash-based & Expiring
CFDs offer access to commodities for (non-US) traders with small accounts. The CFD providers with widest commodity CFD coverage I’ve found after lots of digging are IG and SaxoBank.
Let’s pick an example from IG, for Lumber. Note how IG offers 2 types of CFDs: Undated (cash-based) and Futures (expiring). In some other markets, there is also a selection of contract sizes to choose from as well.
Check the contract size for Futures (expiring) CFDs and Undated ($ cash-based) CFD of $0.275, which matches the point value of the future contract (Lumber Futures Contract Specs - CME Group , CSI Data Commodity Factsheet). But what’s special is that you can trade fractional contracts in the expiring CFD (!). See CSI commodity factsheet tool screenshot below for point value parameter. The IG CFD for the Lumber market has the same point value as the future contract.
So if you bought 1 future contract LBR in Interactive Brokers for example, you get an exposure to Lumber on 23 Apr 2024 of ~14000 USD. If you buy 0.1 expiring CFD in IG you get an exposure of ~1400 USD. Big difference.
I used to trade with IG but had to drop it because I struggled to automate trading with the API due to my sub-par programming skills. But you may be smarter than me. Check out the trading-ig Python library. Output requires a lot of processing to convert to a simple data frame and to match the IG tickers to the market names from your historical data provider.
Now, why would you trade expiring CFDs, if you can simply trade undated CFDs? It boils down to costs:
Undated (cash-based) CFDs carry an overnight funding cost, which you pay daily.
Futures (expiring) CFDs don’t have funding costs. Costs are passed by widening the spread.
In short, for longer term trading, it’s cheaper to trade expiring CFDs. For short term/intraday, it’s cheaper to trade undated CFDs. For long term, the funding costs kill you. Overall it’s easier to make money trading longer term systems (position duration>1 week), so on my personal context I would stick to the expiring CFDs.
From IG: Why is overnight funding charged and how is it calculated? | IG AE
A great resource to learn about these instruments is the Leveraged Trading book by Robert Carver. One well known trader who trades CFDs is Richard Brennan. He shares a wealth of knowledge on trading. Worth listening to his podcasts and YouTube videos to get ideas.
Spread Bets
These instruments are similar to CFDs, but have different tax treatment under some jurisdictions, such as the UK. In the UK, spread bets offer a tax advantage because profits are not subject to capital gains tax nor stamp duty. This is because spread betting is considered as gambling whereas CFDs are considered as financial investments. As far as I understand, broker accounts in countries other than the UK don’t offer spread bets.
Futures
The cheapest and most effective way to trade commodities is through Futures markets. However, it has been historically challenging for retail traders to trade futures with small accounts, as contract sizes for some markets can be huge. However, futures trading is now becoming accessible with the CME (Chicago Mercantile Exchange) micro contracts, and other relatively small contracts available in international exchanges.
Futures are contracts between buyer and seller (such as commodity producer and consumer) to buy or sell a commodity at a given date for a given price. Most commodities are traded this way, as a means for producers and consumers to hedge their exposure to market and environment risks, such as weather impact in crops, etc.
Futures contracts for each market are standardized to a given size (Example 1 US crude oil contract CL gives you exposure to 1000 barrels of oil, and 1 US micro oil contract MCL gives you exposure to 100 barrels of oil), and trade for different expiration months depending on the market. They can trade in different currencies and different denominations (dollars or cents). Some are physically settled, and others are cash-settled, etc. Quite a lot of heterogeneity.
Most brokers don’t allow physical settlement and liquidate the positions upon “first notice date”. Specification of the first notice date is different in each market.
The commodity trader thus needs to build a database of futures market metadata to account for differences in specifications across markets, and to map the ticker from the data source, the exchange and the broker. The below R code shows how to get the list of futures markets available in Interactive Brokers, with their current margin requirements, which is basically web scraping this link. If you use another language, just paste this code to ChatGPT and ask it to translate.
#######################################
#### Fetch futures margins from IB ####
#######################################
#Load required libraries
library(rvest)
library(tidyverse)

# URL of the Interactive Brokers' margin page
url='https://www.interactivebrokers.com/en/index.php?f=26662'

# Read the webpage
webpage=read_html(url)

# Scrape the tables from the webpage
tables=webpage %>% html_table(fill = TRUE)

# Get the list of futures available in IB
tbl=bind_rows(
  lapply(tables,function(x){
    if('symbol' %in% tolower(names(x))){
      NULL
    }else{
      names(x)[1]=strsplit(names(x)[1],' ')[[1]][1]
      names(x)=tolower( gsub("\r|\n|\\s|\\d|,", "", names(x)))
      x%>%
        mutate(across(everything(), as.character))
    }
  })
)%>%
  arrange(exchange,underlying)
If you have an account size of ~100K USD, as a rule of thumb, you can access contracts of <=2000 USD maintenance margin. I’ve found that margin requirements correlate with fractional position sizing: ~ 5 ATR (average true range) loss on 1 contract (very) roughly approximates the margin required by Interactive Brokers site. So you can use this logic to search for which contracts you can trade based on your account size. The chart below shows the rough correlation for several markets with margin <5000 USD.
For strategy simulation I use CSI data. You can get the contract metadata from CSI Data website. Next, you need to build a dictionary of the ticker/symbol of each market from CSI (or your data provider of choice), vs. Interactive Brokers (or your broker of choice).
Examples:
| Market | Int. Brokers | CSI Data | Exchange Symbol | Exchange | FullPointValue |…
|Lean Hogs | HE | LH | HE | CME | 400 |…
|Iron Ore | SCI | SEF | FEF | SGX | 500 |…
Examples:
Live Cattle
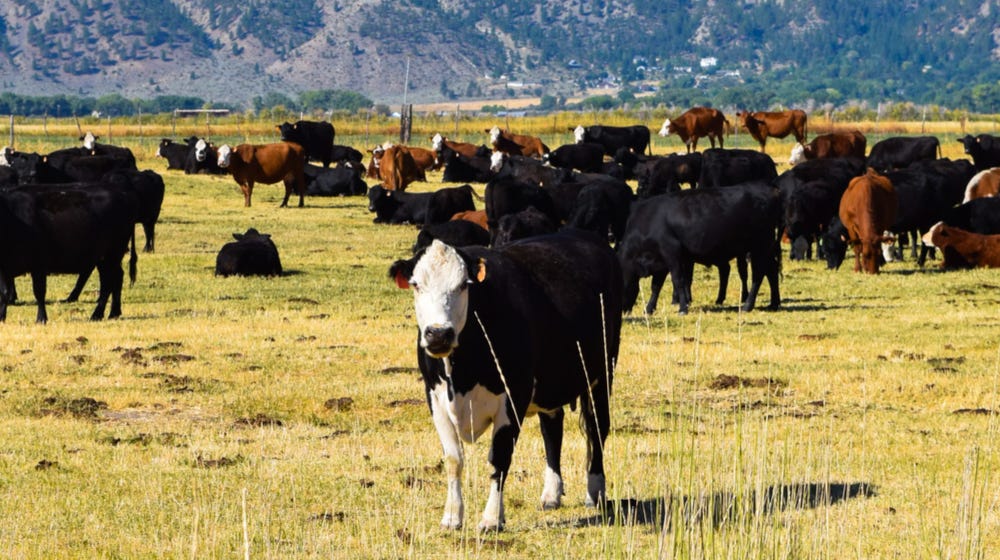
Let’s say we expect the cattle price will increase for whatever reason and we want to buy. Checking the futures contract LE from Chicago Mercantile Exchange, we find that 1 contract corresponds to 40,000 pounds of live cattle, which corresponds to ~30 steers and heifers (castrated males and females which have not borne calf). So you’re entering into a deliverable (physically settled) contract to buy the equivalent of ~1 truck of cattle (!). That’s a pretty sizeable contract.
Of course, as a retail trader you can’t take delivery of cattle. The exchange would liquidate your position at first notice date. See Interactive Brokers contract description showing first notice date.
Usually the open interest (number of contracts held by traders in active positions) of the front (earliest delivery) would dry out by first notice date, and the open interest of the back contract (second earliest delivery) would increase, as traders “roll over” their contracts to avoid delivery and seek liquidity. You can watch this at play in another great resource: BarChart website.
There are no ETF/ETNs which track live cattle price. There is a live cattle IG CFD with point value 2$ (1/2 of futures size), and minimum contracts allowed of 0.25. So you can have 1/8th of the exposure of 1 future contract. (As of today, 1 future contract gives exposure ~70K USD, so 0.25 IG CFD(2$) gives you an exposure of 8800$). Pretty nice if you have access to CFDs, and you either figure out how to automate trading with IG, or are happy with submitting orders manually.
OK… enough with CFDs vs. Futures for now.. now let’s dig into other aspects of commodity markets.
Gold
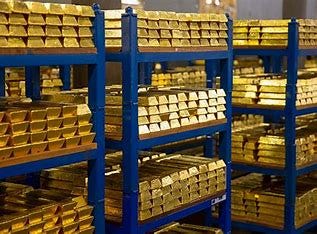
Gold is not a perishable commodity. It can be stored indefinitely in vaults.
This presents interesting characteristics, since some financial instruments can be backed by a physical holding in a vault (hence the instrument price moves in lockstep with spot gold prices, minus some long-term drift due to management fees, storage and insurance costs), and others can be based on futures contracts:
Future: GC (full size, 100 troy ounces), MGC (micro size, 10 troy ounces)
Physically-Backed ETF: GLD, IAU
ETN: UGL
Gold Mining ETF: GDX, GDXJ
Gold Mining Stocks: Barrick Gold (GOLD)
Plotting the gold prices, normalized by the last close, we can see some interesting differences.
The physically backed ETF tracks the gold price very closely, and has a tiny drift over time, attributed to small fees, storage and insurance costs. The micro and full futures contracts also match almost exactly in price, showing a very efficient arbitrage is taking place.
Note how the proportionally adjusted futures time series are historically above the spot. This is because the gold market is usually in Contango, which is jargon for having the future price higher than the current price. Contango is caused by:
Storage costs: warehousing, insurance, maintenance, etc.
Carry costs: costs of financing the purchase of physical commodity to store until the time is sold.
Interest rates: opportunity cost of holding gold vs. returns earned from other investments (such as US treasuries).
Market expectations (supply/demand/speculation/sentiment/inflation)
In the case of gold most of the contango seem to be caused by the interest rates, as we see from the ETFs that the storage costs contribute to a smaller portion of the carry.
Natural Gas
The “carry” (contango and backwardation) is an important aspect to trading commodities. One of the clearest examples is Natural Gas. Gas is expensive to store, and its demand is seasonal, hence we expect to see large differences in prices for different futures contract expirations.
Natural gas consumers, mainly electric utilities companies, hedge their exposure to swings in natural gas prices by purchasing natural gas at different future deliveries, going even years into the future.
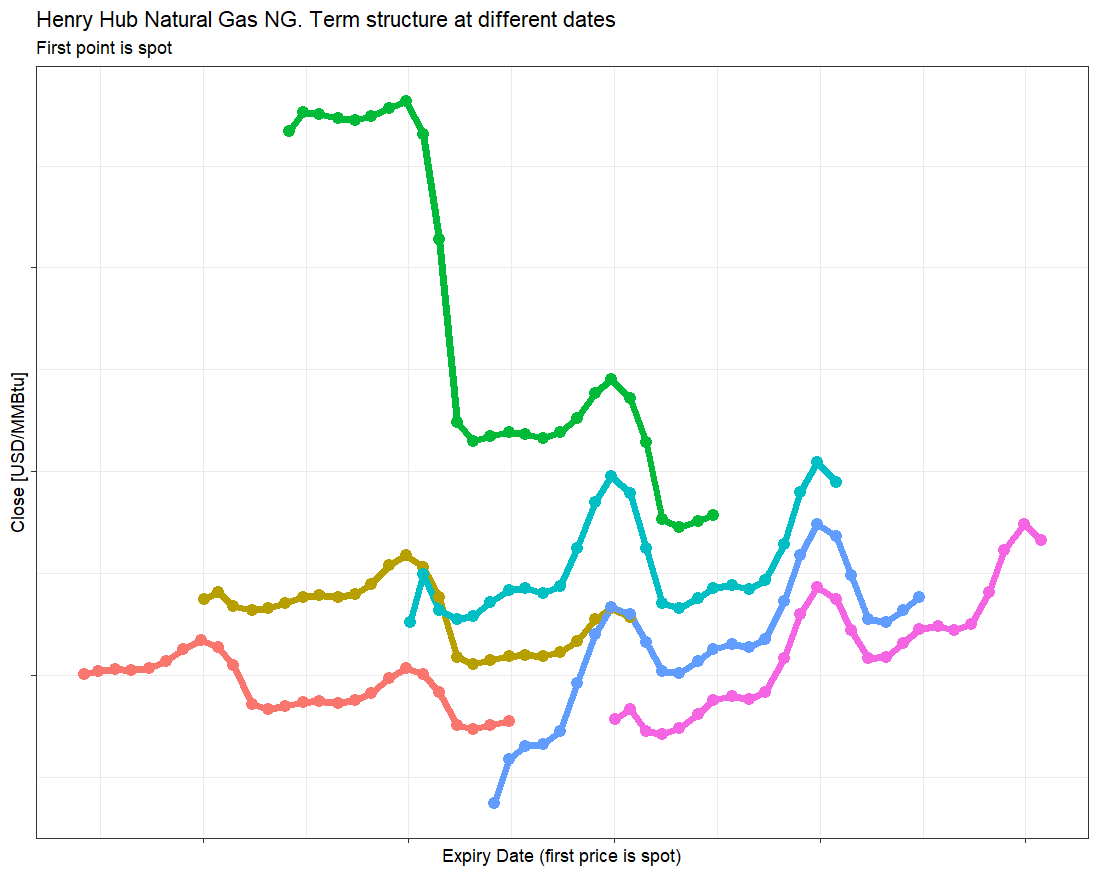
The chart below shows natural gas Term Structure (prices at a given date for different available futures contracts with different expiry dates). Notice any pattern? Let’s see…. There’s a hump around winter months, and a kink from the spot to the front (nearest) futures contract. There’s a high volatility (prices swing around 2 to 8$/MMbtu). Also, there’s steeper price differences around Feb-April expiries, and a change of slope at the April expiry. The March-April spread is called the “widow-maker” due to the sometimes-extreme volatility. Some traders profit from these patterns through a set of strategies which can be bundled as “carry” using outright futures or calendar spreads.
You can check today’s term structure in BarChart.
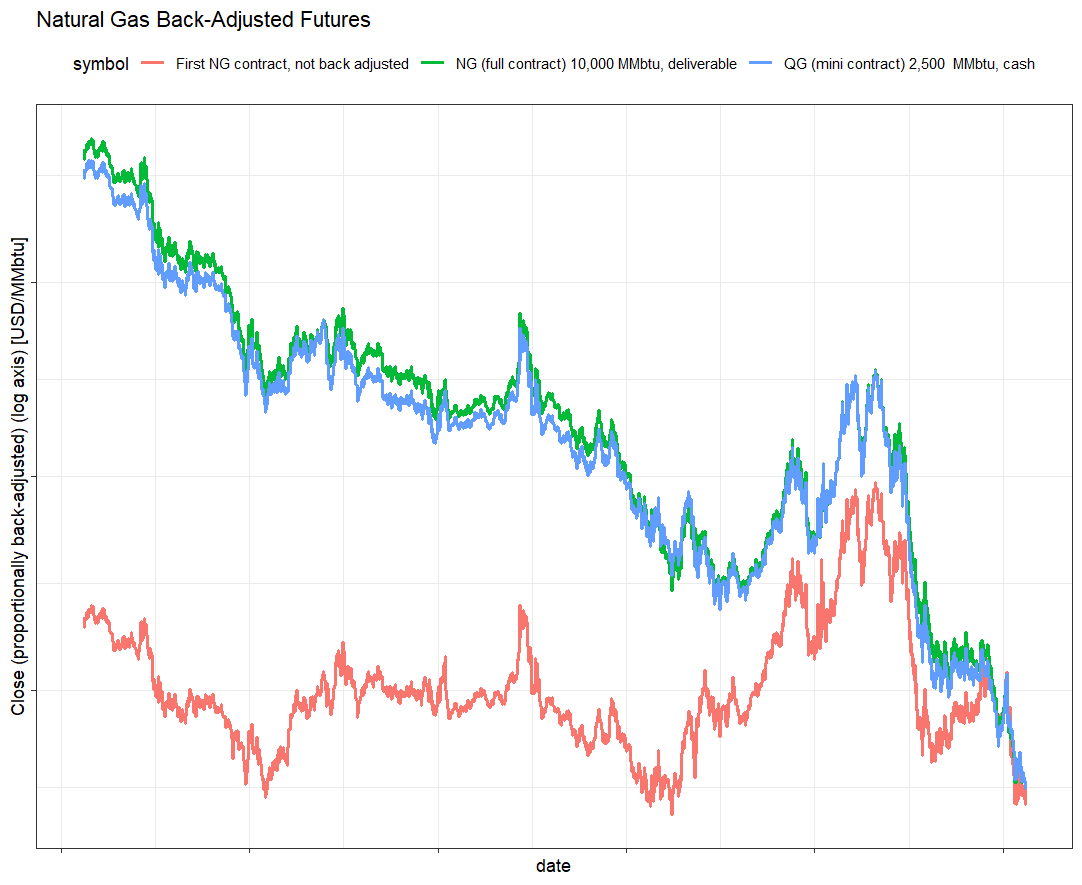
There is a mini contract available for Natural Gas, QG, which is 1/4 of the size of the full contract NG, albeit with lower liquidity. Good enough for retail traders. As explained in previous sections, futures contracts expire so to simulate some trading strategies which require rolling contracts (such as trend following) we have to stitch the time series together, through “back-adjusting” process. See below the proportionally back-adjusted time series for natural gas for full and mini contracts, rolled by open interest (holding the most liquid contract at any given time - usually the front contract). The first contract close (unadjusted) is also plotted for comparison. Note the long-term negative trend, characteristic of a steep contango.
Note also how historical performance of NG (full) and QG (mini) don’t track each other as closely as gold’s GC (full) and MGC (micro). Digging into the contract specifications, I found two differences: 1) Contract expiration date is 1 day earlier for mini contract. 2) Mini contract is cash settled, unlike full contract, which is deliverable. This explains the differences. Remember the market is highly efficient and differences in otherwise identical contracts are arbitraged away by a myriad of market participants.
For a proper performance analysis, it’s better to use log charts. Just be careful to use the correct back-adjusted time series (don’t plot “Panama-canal” back-adjusted series with log charts). Proportionally back-adjusted series can be represented in log charts, as below.
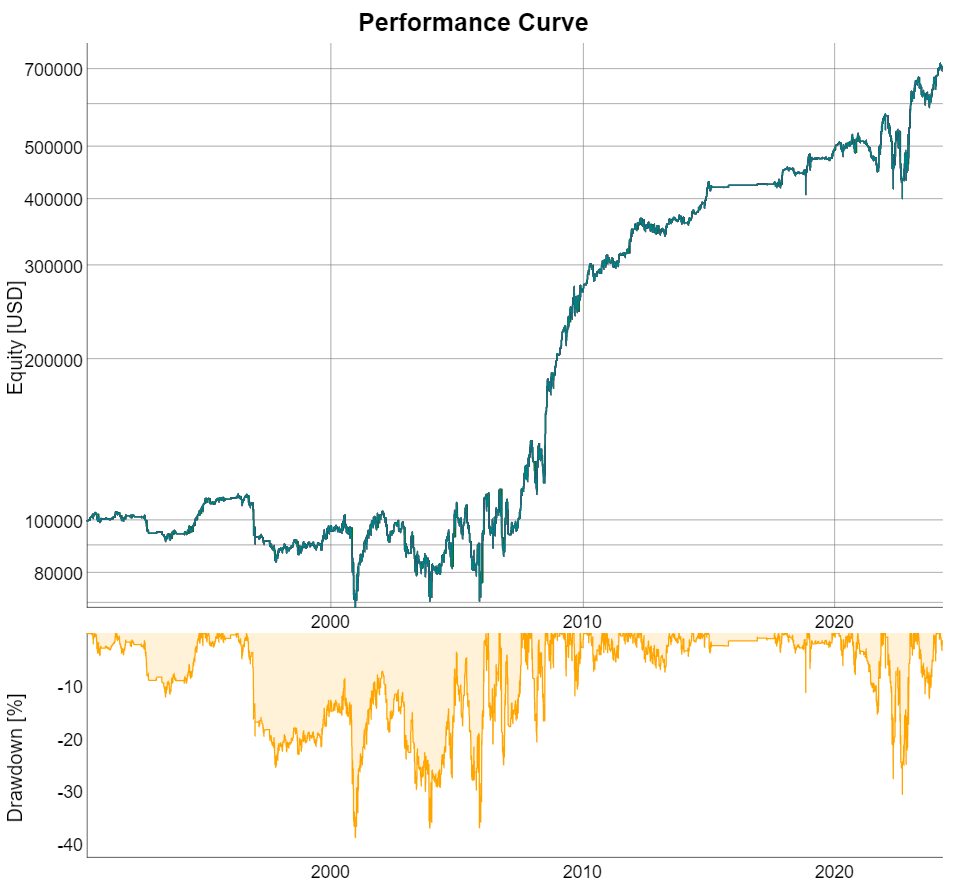
Yes, there is a steep contango observed (futures front contract prices decline as they approach expiry; that “kink” at the front of the term structure, which we observed), so let’s spin off a very simple strategy to go short 1 natural gas NG futures contract for each 100K account size, compounding at each contract roll, holding the front contract until 1 week before expiry when the front contract is higher than the spot price. Let’s see how it looks:
A bit ugly, but profitable. Let’s tweak it a bit by adding a threshold, such as contract close is 4% higher than spot price:
Much nicer. Notice the nasty events in 2004,2005,2006. These “left tail” events are typical in carry strategies. I wouldn’t dare to trade this strategy standalone but would be happy to trade it as part of a portfolio of strategies, with a small allocation (assuming enough capital is available. Big challenge for us small traders).
Now let’s try with a more affordable market, QG, holding 4 contracts, for apples-to-apples comparison with NG (QG contract size is 1/4th of the full NG contract), and shorting the contract only if volume is >500 contracts (volume filter due to lower liquidity):
Not as nice as the full contract, but also profitable. Correlation between the QG and NQ strategies increased a lot after 2010. Note you have to be aware of Interactive Brokers Futures Cut-Out Rules when trading QG and other contracts.
A similar strategy can be implemented in the form of “Curve Carry”, whereas you go long a calendar spread of the front contract vs. a farther out contract. (A long calendar spread shorts the front contract and buys the back contract). Sounds good, but you would have to figure out how to handle seasonality impacts, to avoid getting into a “widow maker” situation.
This is the curve carry strategy shorting the front (first) contract and buying the 7th contract. Example, today (May 2024) you would short May “K” NG contract and buy November “X” NG contract, and so on.
Very nice. More affordable strategy with similar return profile. Notice the tail events, which may be caused in part because we are crossing seasons (summer vs. winter for example). Let’s see if we can trade contracts 1 year apart, to trade the same seasons.
From the BarChart screenshot, we see that liquidity for farther out months dry out, so big players can’t trade natural gas calendar spreads of contracts which are 1 year apart. But small traders can!. Let’s check out the curve carry strategy trading contracts 1 year apart, such as NG May “K2024” vs NG “K2025”, with a 500 contract volume filter.
Looks very nice. Note the few trades in the 90’s due to low liquidity, but the increase in liquidity after 2000. An attractive strategy to add to the portfolio. I don’t know why the strategy was mostly flat throughout the 2010’s, but the natural gas market has gone through some huge changes in fundamentals over the past 2 decades in the USA.
I got this strategy idea from the Top Traders Unplugged podcast. Check out the CCRV ETF as well.
Conclusion:
The beauty of commodities is that it makes it easier to construct uncorrelated trading strategies. You can trade all the markets in the same way, as with a Trend Following approach, and you can also profit from the nuances in each market, with strategies such as the ones above.
I have given you one of my strategies for free, to capture your attention. In future posts I may put these insights behind a paywall, but for now…. let’s see how it goes. Lemme know what you think!
Disclaimer: This content is for educational purposes only and is not investment advice. Do your own homework.


