Trading Commodity Futures Calendar Spreads
Capturing uncorrelated return streams
In this posts we’ll go through commodity futures calendar spreads and their potential as an uncorrelated source of return.
The idea is to trade spreads on commodities, which exhibit at first glance:
Trending behavior (Trend)
Consistent drifts over time (Carry)
Rapid mean reversion when the the spread deviates substantially. (Mean Reversion)
Steepening of the contango curve as front contract gets closer to expiration, in commodities which are expensive to keep stock on (Carry)
Seasonal effects (Seasonality)
Rollover effects. Institutions rolling positions around first notice day (for deliverable commodities), or expiration (for financially settled commodities), which move prices.
Calendar spread strategies allow traders with smaller accounts to afford large contracts such as gasoline, corresponding to 42,000 gallons. We are going long and short different expiration contracts of the same market. There are hundreds of calendar spreads which can be accessed in the futures markets. When trading spreads you de-couple from the movement of the underlying market, hence building a portfolio of spreads would benefit diversification.
One great resource to learn spreads is this futures spreads course from CME.
There are also some great tools around for commodity spreads, such as SeasonAlgo. In fact, I got obsessed with the idea of trading spreads since I saw SeasonAlgo a few years ago but wasn’t able to develop strategies before because my coding skills were not good enough. Few years later… it’s time to take another look!
As usual, the rabbit hole goes very deep in commodities trading, so in this article we’ll focus on #2: Finding spreads which exhibit consistent drift throughout the year (not only a few weeks), and trading it. I tried #1 (trend following) but so far no joy because the behavior of the spreads in commodities is dominated by carry drift. Probably it’s just better in most cases to simply hold some of the spreads instead of trading them based on momentum or historical seasonal performance. Picking a given spread to trade over a given date range within the year compounds the risk of over-fitting, so I’ll try to keep it simple to avoid fooling myself.
Calendar Spread Sources of Return - Research
One thing that was frustrating before was that my code to research on the spreads ran very slowly and consumed all my computer memory. But recently I discovered a technology called DuckDB that runs fast, uses all the processors and manages memory gracefully. I just had to translate the logic to SQL and we’re good to go. ChatGPT and Claude tools make this easy now.
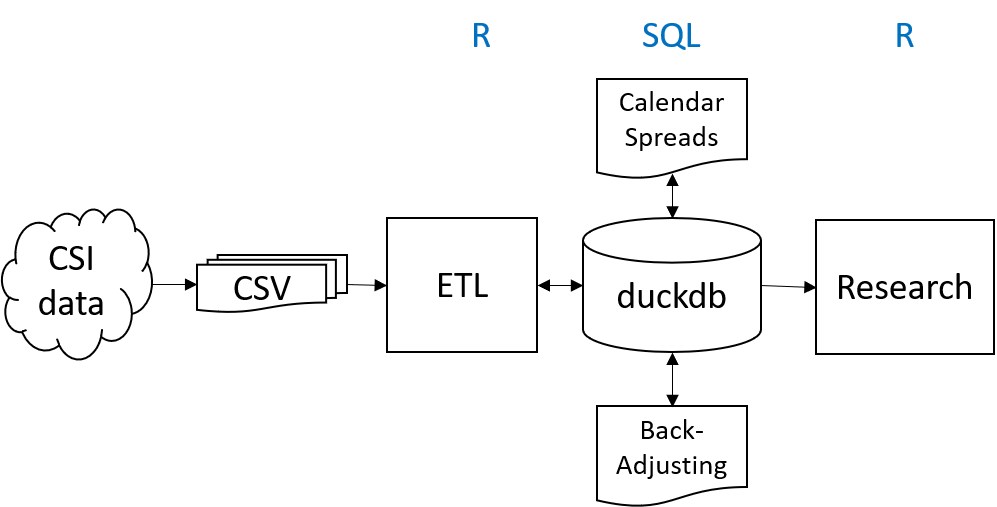
The data arrives from CSI Data (my futures data provider) in 1 CSV file for each individual futures contract (>10K historical contracts in total). An ETL code in R reads the CSVs, does some quality checks, and writes the data into the duckdb database. Thereafter we run 2 SQL scripts in duckdb. One to process the individual futures contracts into back-adjusted time series (one time series for each market), and the other one to compute all calendar spreads, from contiguous contracts to contracts 1 year apart, within the same market. This is how it looks more or less:
Research Stack
The database has 5 tables. One for individual contract data, one for backadjusted data, one for calendar spread data, one for metadata and one with the list of spreads to trade, based on research.
Database ER diagram
Here is a section of the SQL code which generates the calendar spreads:
create or replace table fut_calendar as
with calendar AS (
  select
      f.symbol,
      f.date,
      substr(f.delivery,1,4) as f_year,
      datediff('day', f.date, f.expirydate) as f_dte,
      f.delivery as f_delivery,f.expirydate as f_expirydate,f.open as f_open,f.close as f_close,
      f.oi as f_oi,f.volume as f_volume,
        b.delivery as b_delivery,b.expirydate as b_expirydate,b.open as b_open,b.close as b_close,
        b.oi as b_oi, b.volume as b_volume,
        substr(f.delivery,5,1)  || '_' || substr(b.delivery,5,1) as nm
    from fut f
        inner join(
            select symbol,date,delivery,expirydate,open,close,oi,volume
            from fut
        ) b on f.symbol=b.symbol and f.date=b.date
          and datediff('day',f.expirydate,b.expirydate)>20
          and datediff('day',f.expirydate,b.expirydate)<370 -- Max 1 year btw
    where f.symbol in (<put your list of markets here>)
)

select * from calendar;
In my actual implementation (not shown) I further stitch together, “backadjust” these calendar spreads, to get a single time series for each contract and month code combination. Thereafter the SQL code also does a simplified PnL calculation of holding the spread when the volume of the contracts of both legs is beyond a threshold of, say, 1000 contracts.
Let’s pick Corn as an example, so that you can cross check against SeasonAlgo (Analytics for Corn is available in the free subscription tier).
This is a matrix of the PnL of holding different corn spreads from 1994 to 2014, where volume is acceptable (>1000 contracts) on both legs. Let’s reserve the last 10 years for validation.
The month codes are listed here: CME contract month codes. Here is the table for easier reference:
Notice the consistent drift in some spreads? Probably we can simply open a spread position when the volume is sufficient, and hold it until first notice day, or roll to next year’s contracts (if sufficient volume available).
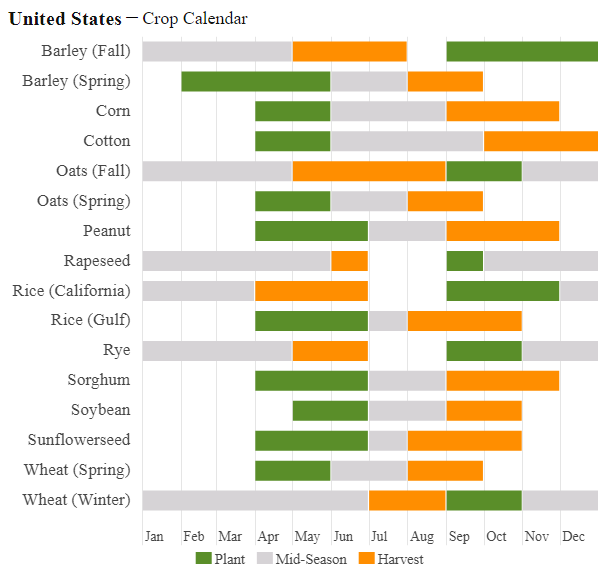
Let’s find an explanation for the observed behavior, based on literature and intuition. Here is the crop calendar for USA, which we can use to define the spreads for different agricultural commodities:
Another nice resource is RJO Futures website.
Notice the U_Z, U_H, U_K, U_N spreads (September (front) vs December, March, May, July) have a clear downward drift.
According to the agricultural calendar, September is the start of the harvest season for corn. April-May are next year’s planting season. I will pick the U_K spread, to capture somewhat the “old crop vs new crop” trade.
Searching the literature for common Corn spreads, we find that U_K is not such a commonly traded spread. But I believe it makes sense to trade it: it captures the price differences between the old crop and the new crop, due to storage costs, seasonal demand, and weather uncertainties. My theory: as we move forward towards expiration of the front contract, these uncertainties, which are prices in the spread, reduce, causing a part of the negative carry drift we observe.
Let’s also pick the Z_N spread, which is a more popular spread trade, also to capture differences in demand and supply expectations for old and new crop seasons.
This is the performance of holding 1 spread contract per 100K USD portfolio size, for U_K and Z_N, shorting the spreads then volume in both legs is >1000 contracts. Assuming 3 ticks slippage on each leg to be conservative.
The spread drift remains roughly consistent through the last 10 years (our out of sample period). We are onto something here….
Let’s confirm the observations using SeasonAlgo free tier:
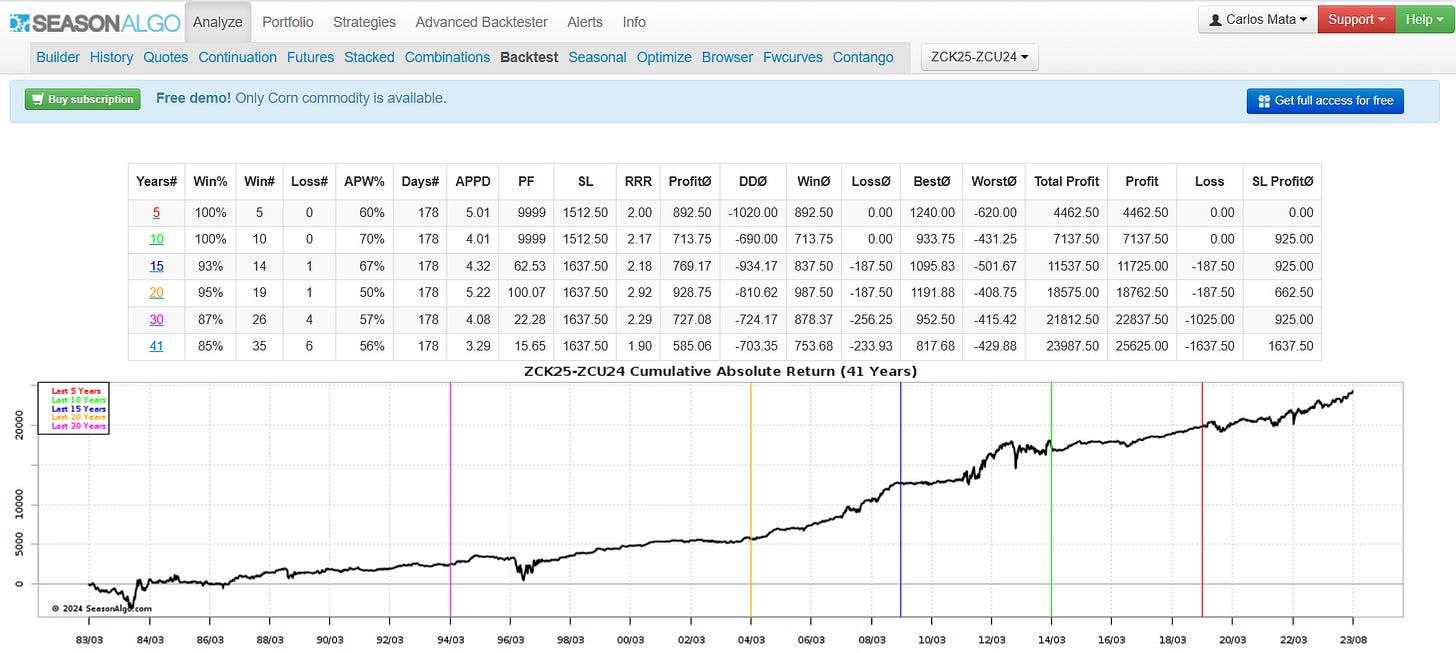
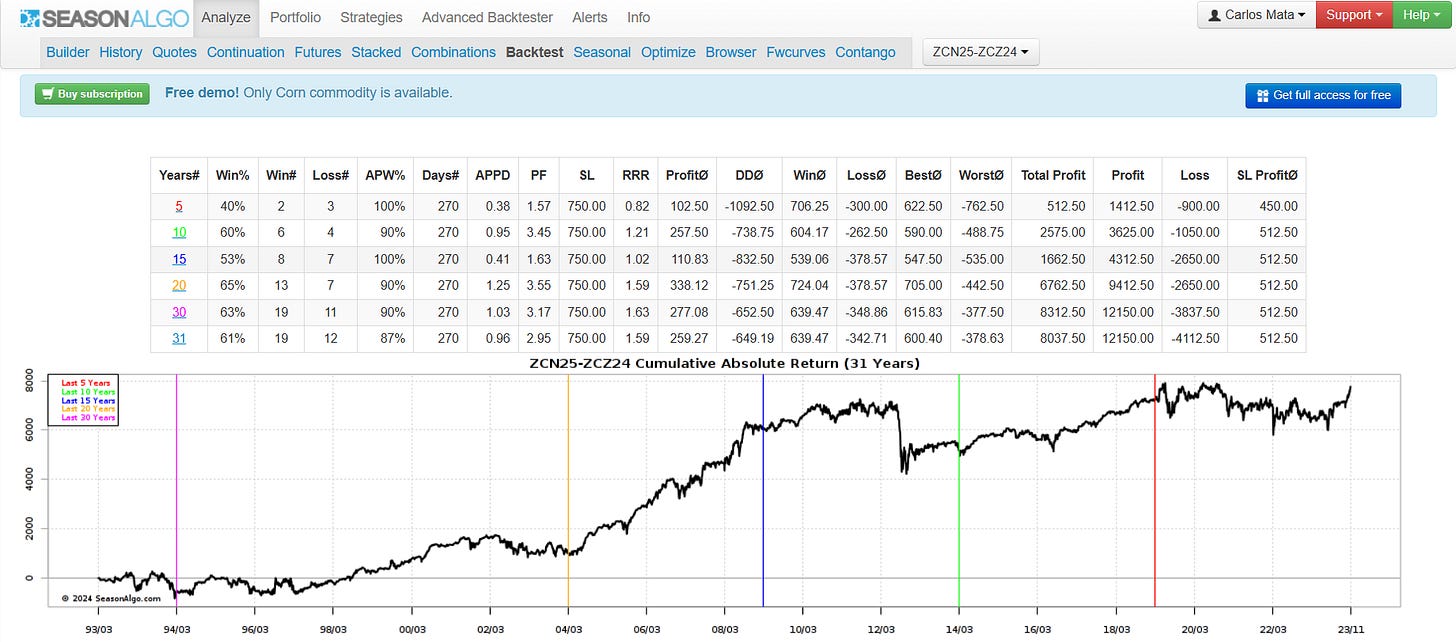
Yep… looks good.
Risk Assessment
Now consider the risks:
You see in courses, articles and blogs that spreads are less risky than outright futures. I do not believe that to be the case: when you normalize by dollar volatility, the spreads seem more risky (higher tail risk).
Higher kurtosis (fatter tails on the return distribution). Everything looks nice and pretty, then one day ….kaboom… a huge sudden move. Need to reduce risk by trading many spreads with small positions.
Underlying mechanics of the market (characteristics of the convenience yield, etc.) can evolve over time so the chosen spread list needs to be reviewed periodically.
Spreads around season changes, like the infamous Nat Gas “Widow Maker” March vs April (H_J) spread are more unstable. I would prefer to pick spreads across middle of seasons like middle of summer vs middle of winter (July vs December, for example).
Contract prices closer to expiration get more sensitive to current events. We may reduce risk by picking the front contract with >X days to expiration (liquidity fizzles away though).
Low volume markets can get poor executions with market orders. Consider using limit orders or making an execution algo. Unfortunately adaptive algo orders are not available for futures spreads in Interactive Brokers.
A nasty example: Look at Wheat spreads at the onset of the Ukraine war (a war between two major wheat producers):
KA-BOOM. The spread blows up in your face. It recovers super-fast thereafter however (hopefully you didn’t panic close the position when bleeding).
As mentioned above, we would expect deeper drawdown in the spreads closer to expiration. N_Z (July vs December) should get a bigger drawdown than U_H (September vs March) based on our risk assumptions. Is this the case?
Yes that’s the case. BUT the spread closer to expiration (N_Z) also recovers faster. Interesting, innit?
Portfolio Performance
I repeated the same spread selection exercise using 1994 to 2014 data for all liquid commodities (US and International) and built a register of 0-2 spreads exhibiting drift for each market, with an explanation attempt for each spread. If I have to choose between 2 equally good spreads, I pick the one more commonly used by large producers and speculators, as per the literature.
Now, how to size the positions? In this example, I will size by ATR of the back-adjusted series for the outright futures market:
We can risk, for example, 1% of the account if the spread value moves 1 full ATR of the outright futures price. That would correspond to a leverage factor of 0.01 in the above formula.
This is the out of sample portfolio performance, including costs:
This simulation has no stop losses; no seasonality / month / week preferences; no trend validation. Simple carry so far. Definitely deserves deeper research.
Due to the fast mean reverting nature of the spreads, probably using stop losses would make the performance worse. I leave it to the reader to experiment with stop losses. For intraday stops, you would need intraday data to test it properly.
Diversification Analysis
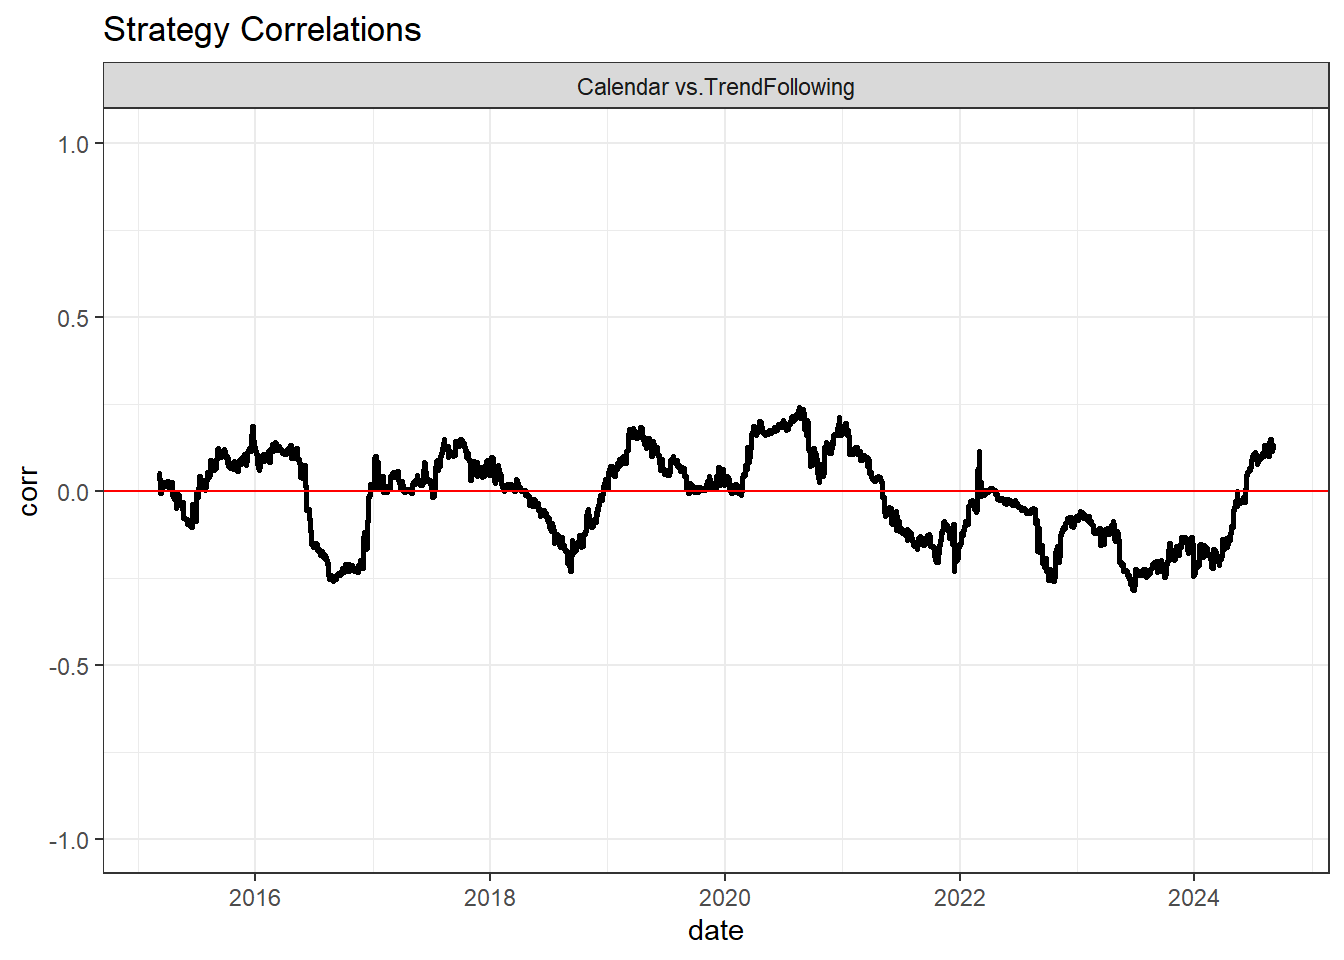
The calendar spread portfolio performance should be uncorrelated to a trend following strategy. Let’s check:
Rolling correlations are around 0. This strategy should be a powerful diversifier. Let’s make a “Naive” 1/N allocation to both Trend Following and Calendar Spreads portfolio (50/50, with both strategies scaled to 15% annualized volatility). This is how it looks:
Combining the strategies yields a significant performance improvement. So yes, Trend + Carry is a winning combination.
Mean reversion strategy?
Given the nature of the spreads to suffer large spikes with subsequent fast recoveries, it would be great to test a potential mean reversion strategy using limit orders. This would need a different tech stack as higher frequency data is required to determine the spread’s daily high and low values. With daily data we can know the spread open and close price since both legs have the same opening and closing times, but we cannot know the daily spread high and low. With daily data we can evaluate a mean reversion on open and close data only. This research is in my to-do list.
Execution Considerations
Interactive Brokers does not provide adaptive algo functionality for futures calendar spread orders. It also does not provide calendar spread orders yet for the newly added Palm Oil (FCPO.MY) market.
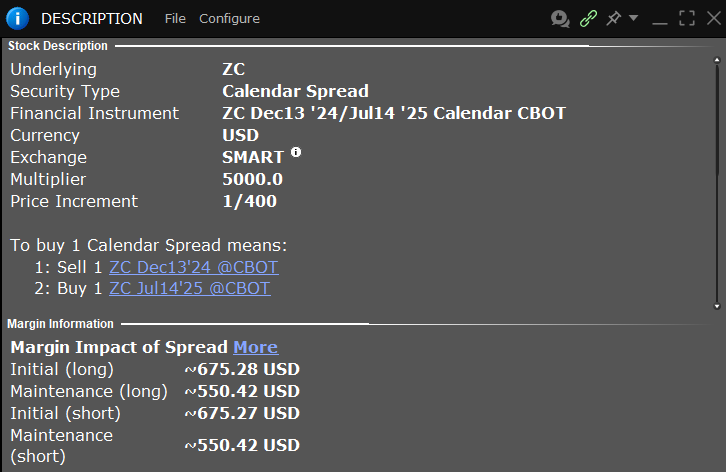
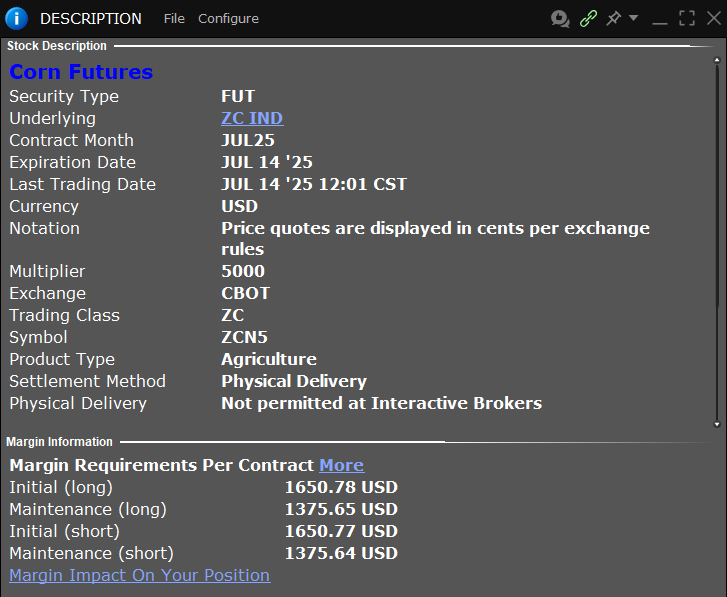
Exchanges list dedicated spread contracts, which enters both legs simultaneously. The spread contract tick size is smaller than the outright futures contract tick size in some markets. Margin requirements for spreads are also lower than outright futures. See below example for Corn:
This makes it possible to trade a portfolio of spreads without consuming all the margin. But beware!…. Gotta trade small.
Conclusions
Commodity futures calendar spreads are a very interesting play.
Commodity calendar spreads can exhibit a drift.
The spread behavior is uncorrelated to the outright futures market.
We can assemble a portfolio of spreads and trade them infrequently. Since correlation is small between spreads, risk adjusted returns would be decent.
Trading a portfolio with many spreads at small size helps reduce the tail risk, like the wheat example shown.
Calendar Spreads where front leg is closer to expiry are more exposed to event risks (news, weather issues, etc.).
Calendar Spreads can experience large sudden losses. High kurtosis / tail risk.
There is potential in mean reversion strategies on a portfolio of calendar spreads. To be researched further.
Margin requirements for calendar spreads is lower than for outright futures, which allows assembling such portfolio without consuming all the account margin.
Tech stack - wise, duckdb enables the fast computation required to research calendar spreads and keeps things tidy in database.
Disclaimer
This post is documentation of research by the author and does not constitute financial advice. Consider it for educational purposes only. Do your own homework.






Man - this is really detailed. I never trade this way, but boy what a great roadmap to consider if you ever wanted to get involved in it. Good writing!
Great work!